Most deployment tools start to hurt at the same moment. You have one service and everything is fine. Then you add a queue consumer, a nightly report, a second service that depends on the first, and a database password that has to live somewhere. Suddenly the "deploy" step is a shell script, a cron file on one server, a .env file nobody wants to open, and a lot of hope.
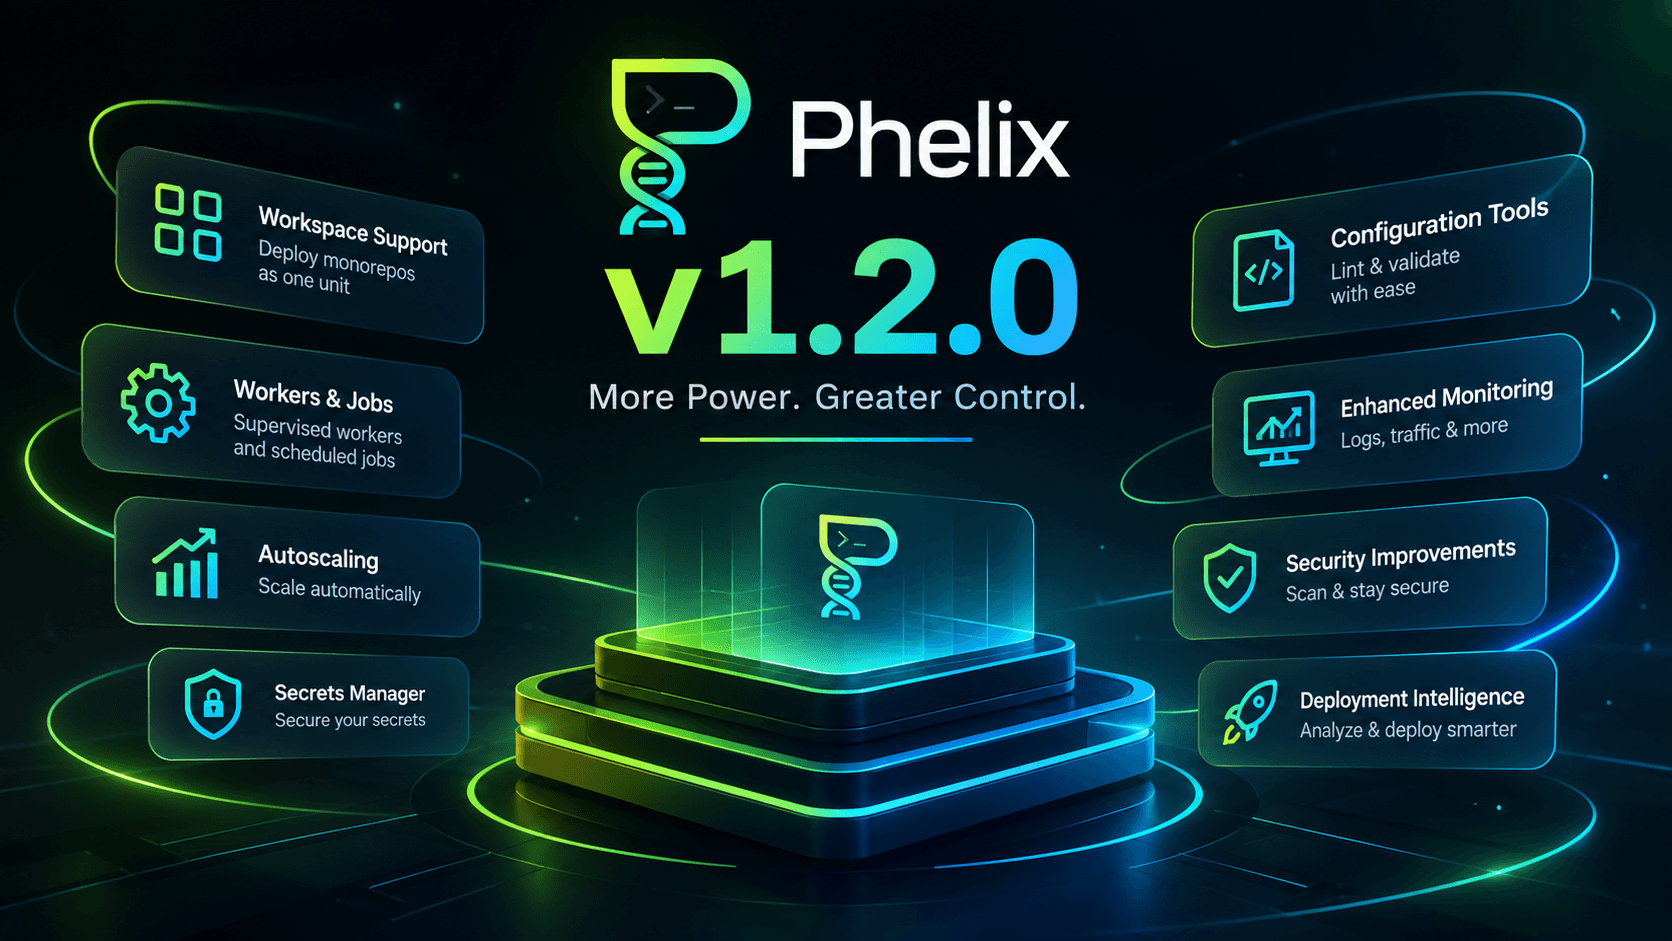
Phelix v1.2.0 is built around that moment. Until now Phelix was very good at one thing: building a Go or Rust app, versioning it, and cutting traffic over to the new version safely. This release extends the same fail-safe model to everything around that app. You can deploy a monorepo as one unit, run supervised background workers, schedule jobs, scale replicas automatically, keep credentials out of your config and your builds, and manage most of it remotely.
If you are new to the project, read the Phelix overview for Go and Rust deployments first. This article assumes you know the basics and goes deep on what changed and why.
The code lives on GitHub and the project site is phelix.anophel.com.
Contents
- What is Phelix
- Workspaces: deploy a monorepo as one unit
- Workers: supervised background processes
- Scheduled jobs: cron with a paper trail
- Autoscaling and per-replica metrics
- Secrets: credentials that never touch a build
- Configuration: lint, schema and dashboard editing
- Lifecycle hooks
- Deployment rollout analysis
- Security scanning
- Monitoring, logging and remote control
- Rust builds and CLI size
- Upgrading to v1.2.0
- FAQ
What is Phelix
Phelix is a single-binary CLI for building, running, versioning and zero-downtime deploying Go and Rust applications on a host. It records every build as a numbered version, promotes a version only after its health check passes, switches traffic atomically through its own proxy, and lets you roll back to any retained version. It is offline-first, so build, deploy and rollback work without an account or a network connection.
The strategies it offers for zero-downtime releases (blue-green, rolling and canary) are covered in detail in Blue-Green Deployment with Zero Downtime for Go and Rust. Several features in this release reuse those same mechanics, so that article is a useful companion.
Workspaces: deploy a monorepo as one unit
The problem
A typical Go or Rust monorepo holds a gateway, an auth service, an orders service and some shared libraries. Without workspace support you register each service separately, build each one by hand, and deploy them in whatever order you remember. There is no shared deployment order and no single view of the whole system. The classic failure is shipping a consumer before the service it calls, which means the new gateway is up and talking to an auth service that has not been deployed yet.
How discovery works
Phelix finds a workspace in one of three ways:
| Source | How it is found |
|---|---|
phelix.workspace.yaml | An explicit manifest in the workspace root. It wins when present. |
go.work | A native Go workspace. The use entries are the member modules. |
Cargo.toml | A native Cargo workspace. members or default-members, minus exclude, with globs expanded. |
Only members Phelix can actually run are considered: a Go module with a main package, or a Rust crate with a binary target. Library-only members are skipped because they are not deployable services. A go.work file that lists a missing module fails the whole workspace instead of silently shrinking it, which is exactly the behavior you want from a deployment tool.
The manifest
name: shop

services:
  auth:
    path: ./services/auth
    port: 8081
    strategy: blue-green
  orders:
    path: ./services/orders
    port: 8082
    depends_on: [auth]
  gateway:
    path: ./gateway
    port: 8080
    strategy: rolling
    replicas: 3
    depends_on: [auth, orders]
Each service can pick its own strategy (classic, blue-green or rolling), and depends_on defines the order. Cycles, unknown names, paths that escape the workspace root and duplicate explicit ports are all rejected before anything runs. If you leave a port out, Phelix assigns one from --port-base and records it, so later runs keep the same port.
Commands and what they guarantee
phelix build --all        # topological build, parallel within each level
phelix deploy --all       # depends_on order, first failure halts the mesh
phelix status --workspace # one table: version, health, port, strategy
phelix rollback --all     # previous version for every service, reverse order
The details matter here:
- Builds run in dependency levels. Services that do not depend on each other compile in parallel, bounded by
--concurrency(default 3). If a service fails, no service in a later level starts. - Deploys are strictly ordered and one at a time. Each service still goes through its own health gating, its own strategy and its own per-app deploy lock, so a workspace deploy never bypasses single-app safety. With
--auto-rollback, the failing service is restored to its previous version before the run halts, so it keeps serving while you investigate. - Rollbacks run in reverse order. Consumers come down before the providers they rely on.
- Status reflects reality. A service is
runningonly when its serving process is alive, never because a state file says so. A service with no health configuration shows-, which means "not configured", and never "unhealthy".
Phelix also takes a workspace-level OS file lock, so two whole-mesh operations cannot interleave. Because the kernel releases the lock when its holder dies, a crashed deploy never leaves a stale lock behind. A contended lock fails fast with WORKSPACE_LOCKED.
For automation, build --all, deploy --all, status --workspace and rollback --all each emit a single JSON envelope for the whole run, with per-service progress on stderr:
phelix status --workspace --json | jq '.result.services[] | {name, status, version, port}'
Known limits
Native go.work and Cargo members carry no dependency information, so without a manifest they all build in one level. Canary and progressive rollouts are deliberately not available inside a workspace manifest, because they verify traffic over time for a single service while a workspace deploy halts the whole mesh on the first failure. Docker-runtime services must be built and deployed on their own.
Two runnable examples ship in the repo for Go and Rust. The full reference is the Workspaces guide.
Workers: supervised background processes
The problem
Not every Go or Rust program serves HTTP. Redis and Kafka consumers, email senders and background processors have no port, no proxy route and no meaningful HTTP health check. Before 1.2.0 you had to wrap them in systemd units or a process manager and lose Phelix's versioning, rollback and rolling deploys along the way.
The worker model
A worker is declared with type: worker. It never allocates a port, never receives a PORT variable, and never gets proxy routes. Startup success means the process is alive and, in exec mode, passing its probe within startup_timeout.
name: email-worker
type: worker

process:
  restart:
    policy: on-failure        # always | on-failure | never
    max_attempts: 10          # consecutive failure-driven restarts before crashloop
    backoff:
      initial: 2s
      max: 60s
      multiplier: 2
  shutdown:
    signal: SIGTERM
    grace_period: 30s         # SIGKILL escalation after this wait
  startup_timeout: 30s

health:
  mode: process               # process (default) or exec

deploy:
  strategy: rolling           # classic (stop-all, start-all) or rolling
  replicas: 3
  rolling:
    max_surge: 1
    max_unavailable: 0
    drain_timeout: 60s

resources:
  cpu: 500m
  memory: 512Mi
What supervision actually does
The monitor daemon (phelix monitor) runs one supervisor loop for every worker app. For each replica it compares the persisted desired state with what is really running. Identity is checked using the PID, the executable path and the kernel start time from /proc/<pid>/stat, so a recycled PID is never mistaken for the original process.
Restart behavior follows the policy:
| Policy | Exit code 0 | Non-zero, signal or OOM |
|---|---|---|
always | restart | restart |
on-failure | no restart, replica marked completed | restart |
never | no restart, completed | no restart, failed |
Restart delays grow as initial * multiplier^attempt, capped at max, with plus or minus 20 percent jitter. The jitter solves a real problem: when a Redis or database outage kills a whole fleet at once, identical backoff timers make every replica reconnect in the same instant. After max_attempts consecutive failures the replica enters crashloop and stays there until you restart it or redeploy. A replica that stays healthy for the 300 second stable window gets its failure counter reset.
Exec health checks run your command directly, without a shell, and enforce the timeout with a process-group kill so a probe can never leak child processes. A number of consecutive failed probes (retries, default 3) causes exactly one health-driven restart.
Day-2 operations
phelix status email-worker               # replica tree: pid, status, restarts, last exit
phelix scale email-worker --replicas 5   # grow or shrink in place, no rebuild
phelix restart email-worker --replica 2  # one replica, resets its crash counters
phelix log email-worker --replica 2      # one replica's output
Scaling up launches new replicas at the current version from the recorded environment snapshot. Scaling down drains the highest-index replicas as intentional stops, so they never count as crashes.
Rolling deploys without a proxy
phelix rebuild on a worker replaces one replica at a time: launch the replacement, prove it with the startup gate, then drain the old replica within drain_timeout. There is no proxy step, because there is no traffic to route. Every per-replica transition is journaled. If a deploy fails, the engine reverts exactly the replicas it already replaced. If a revert step itself fails, the state is persisted as recovery_required and shown in status, because Phelix never reports a rollback that did not happen. If the daemon dies mid-rollout, the journal detects the interrupted deploy and reverts it on the next start.
One honest caveat from the docs: draining is a SIGTERM plus a bounded wait. Whether in-flight work is truly finished is your application's contract, so treat SIGTERM as "finish the current message, ack or nack it, then exit".
Remote control is covered by #53, which exposes full worker control through gRPC, including a worker_scale command that is idempotent by request key. Workers are native-runtime only in this release. The full reference is the Workers guide, and the repo includes a runnable worker-go example.
Scheduled jobs: cron with a paper trail
The problem
Cron on a random server is hard to audit. It is not versioned with your code, it has no timeout, overlapping runs are your problem, and when something fails at 3 AM the only evidence is whatever the script remembered to log. Phelix v1.2.0 makes a recurring task a first-class workload.
Defining a job
name: nightly-report
type: job

schedule:
  cron: "0 3 * * *"
  timezone: Europe/Paris
  missed: skip

job:
  command: ["./nightly-report", "-message", "nightly report"]
  timeout: 2m
  retries: 1
  concurrency:
    policy: forbid
A job must declare both schedule and job, and it must not declare a port, health check, process or deploy block. phelix config lint enforces the same rules as a build.
Behavior worth knowing
- Timezones are explicit. The cron expression is evaluated in an IANA timezone, default
UTC. - Missed runs are skipped, never replayed. If the monitor was down, restarting it does not trigger a catch-up burst. A job that runs longer than its interval also skips the occurrences it missed instead of stacking them.
- The same instant never runs twice. Before starting an occurrence the monitor checks persisted records, so a restart cannot double-fire a schedule.
- Commands run without a shell. The command is an argv array. If you need pipes or globbing, say so explicitly with
["/bin/sh", "-c", "..."]. - Timeouts kill the whole process group, and the run is recorded as
timed_out. Retries run sequentially and the log keeps the output of every attempt. - Overlap is controlled. With
forbid(the default) a scheduled run that finds the lock held is recorded asskipped. Withallow, overlapping runs are permitted. - Secrets are available and redacted. A run receives the version's environment snapshot plus the app's secret bindings, and captured output is redacted line by line.
A job is built and versioned like any app, but nothing is started. It has no port, no proxy route and no replica.
The audit trail
phelix job list
phelix job run nightly-report
phelix job history nightly-report --limit 5
phelix job logs nightly-report --execution job_a1b2c3d4e5f60718
Each run has a record and a redacted log file. Statuses include succeeded, failed, timed_out, cancelled, skipped and interrupted. At startup the monitor closes out any run left over from a previous process as interrupted, so history never lies about a run that was cut short. The 200 most recent finished executions are kept.
Remote management arrives in #68 through MonitorStream: run a job, read history and logs, and receive lifecycle events without SSH.
Current limits are honest ones. Only the monitor runs schedules, only skip exists for missed occurrences, locks assume a single host, and there is no distributed scheduler. The reference is the Jobs guide.
Autoscaling and per-replica metrics
The problem
Manual scaling works until load changes while nobody is watching. Naive autoscaling has its own failure modes: flapping up and down, scaling on stale data, treating "no data" as "zero load", and racing against a deploy that is already changing the replica set.
How the controller works
The monitor daemon runs one controller per app. Every interval (default 15 seconds) it samples per-replica CPU and memory plus windowed proxy traffic (requests per second, error rate, P95 and P99 latency), evaluates a decision, and executes it through the existing scaling paths. Workers scale through the worker scaling path, and rolling services through the rolling scale executor. Both take the same per-app deploy lock as deploys, rollbacks and manual scaling.
deploy:
  autoscaling:
    enabled: true
    min_replicas: 1
    max_replicas: 5
    interval: 15s
    metrics:
      cpu:
        scale_up: 65
        scale_down: 30
      memory:
        scale_up: 80
        scale_down: 40
      requests_per_second:
        scale_up: 500
        scale_down: 50
      latency:
        scale_up_p95: 200ms
        scale_down_p95: 80ms
    scale_up:
      evaluation_windows: 3
      cooldown: 60s
    scale_down:
      evaluation_windows: 5
      cooldown: 180s
      stabilization_window: 300s
The decision policy
The rules are deliberately conservative:
- Scale up when any enabled metric breaches its upper threshold.
- Scale down only when every enabled metric is at or below its lower threshold.
- Scale up wins conflicts.
- Every decision moves the desired count by exactly one replica, clamped by
min_replicasandmax_replicas. - A sample older than twice the interval decides nothing.
- Missing metrics never trigger a scale-up and they block scale-down.
- A failed execution never consumes its cooldown.
If max_replicas is not set it defaults to deploy.replicas, so turning autoscaling on never silently widens the fleet beyond what you declared. Scaling a rolling service reuses the active version's artifact, so there is no rebuild and no new version. The new replica is health-gated before it joins the proxy, and victims are removed from proxy membership before they are drained. If the daemon dies mid-scale, an interrupted scale converges on the next start.
Per-replica observability
This is the part that makes autoscaling trustworthy, and it is useful on its own. CPU is measured per logical core, so a replica using two full cores reports 200 percent. Memory is measured against the replica's own resources.memory limit, not the host's RAM. Every dimension carries an explicit validity state (available, initializing, unavailable, stale or process_exited), so a missing number is never rendered as zero.
The same sampler feeds phelix status, phelix autoscale status and the monitor stream, so the CLI and the dashboard see one definition. Collection does not depend on autoscaling being enabled, which means a single hot replica now shows up even if you never scale automatically.
Control and audit
phelix autoscale status
phelix autoscale pause
phelix autoscale evaluate
phelix autoscale history
Pause state survives monitor restarts. Every decision and its outcome is appended to the app's autoscale history, and remote control goes through autoscale_* MonitorStream commands gated by the scale authorization action. See #60 and #65.
Secrets: credentials that never touch a build
The problem
Environment variables are snapshotted with every build so that a rollback restores matching configuration. That is great for plain settings and dangerous for credentials. A database password stored the same way ends up copied into every version snapshot, and a rollback can resurrect a password you already rotated or deleted.
The model
Each app gets its own encrypted secret store, separate from environment variables, from phelix.yaml and from build versions. Values use AES-256-GCM under the same master key Phelix uses for environment variables. The store directory is 0700 and the files are 0600. Every write creates a new version, the five most recent are kept, and each is identified by an HMAC fingerprint that tells you whether a value changed without revealing it.
Your config references secrets by name only:
secrets:
  imports:
    - secret: database_url
      env: DATABASE_URL
    - secret: redis_password
      env: REDIS_PASSWORD
phelix secrets set database_url < db-url.txt
phelix secrets list
phelix secrets history database_url
phelix secrets apply
Values come from stdin or --from-file, never from a command argument, because arguments are visible to every process on the host. There is no command that prints a value. phelix secrets get returns metadata only, and that is true by construction, not by filtering.
Launch-time resolution
Secrets are resolved at every start, restart and rollback. They never enter a build or a version snapshot. This has a useful consequence: rolling back restores the old binary and the old plain variables, while credentials stay at their current values. A rotated or deleted credential can never be resurrected by a rollback.
phelix secrets set stores the new version and, if a running app imports it, restarts the app through the same path phelix restart uses, honoring the app's deployment strategy. You change a password without a rebuild. Use --no-apply to store a value without touching the running app.
Journal-backed deployment transactions
During a deploy, every instance must receive the same credentials. Phelix pins the bindings once at the start, opens a binding transaction in the secret store before any instance changes, and stamps its deployment journal with the transaction id. The journal is then the single source of truth:
- If the journal shows the deploy was accepted, the candidate bindings are committed.
- If it shows the deploy was never accepted, the candidates are discarded and the previous bindings stay active.
- If the journal cannot be read, nothing is committed and the situation shows up in
phelix doctor.
The daemon settles leftover transactions at startup, so a crash mid-deploy cannot leave two versions of the truth.
Redaction and failure behavior
The hardening in #57 adds output masking. Every secret value a Phelix process resolves is masked in log records, the dashboard stream, CLI rendering, error output and Docker command lines, for as long as a running instance or a draining log stream could still produce it. The docs are clear about the limit: Phelix redacts what passes through Phelix. If your app writes its own secret to journald or a third-party service, that is outside the guarantee.
Failure handling is strict. A declared import with no stored value stops the deploy with SECRET_NOT_FOUND, so nothing starts partially configured. An unreadable store only affects that one app. Details are in the Secrets guide and #56.
Configuration: lint, schema and dashboard editing
The problem
A typo in phelix.yaml should fail on your laptop or in CI, not during a production deploy. YAML makes this hard, because a misspelled key is often silently ignored and the tool happily runs with the default.
phelix config lint
phelix config lint validates the file in the current directory with strict key checking, without building, starting or touching anything.
$ phelix config lint
  ✓ /home/me/api/phelix.yaml is valid (1 health endpoint(s), strategy classic)
Exit code 0 means valid, 40 means a configuration error, and 12 means no phelix.yaml was found. Unknown keys fail with the dotted key path and the source line. It also catches duplicate keys, multiple YAML documents and contradictory workload settings, such as a job that declares a port. The stricter port diagnostics from #55 land here too. It supports --json, which makes it a one-line CI gate.
phelix config schema
phelix config schema > schema.json
This prints a JSON Schema (draft 2020-12) generated from the same structs the loader decodes into, so the schema cannot drift from the real behavior. Point a YAML language server at it and you get completion and hover text in your editor. The repo also ships the same document as schema.json.
Dashboard configuration management
#73 brings the same validation to the dashboard. You get a visual builder and a YAML editor that edit the same draft. The server asks the owning CLI agent to run the same validation local commands use, without running a build, hook or job. Some design choices are worth calling out:
- Optimistic concurrency. Each save checks the revision the editor loaded and replaces the file atomically. If the file changed in another tab or through the CLI, you get a conflict instead of an overwrite.
- Permissions. Viewing needs viewer permission and saving needs permission to manage application settings. Fields you cannot access appear read-only, and a document containing data you cannot see is withheld entirely.
- No secrets. Configuration management never retrieves environment variables or secret store values, and webhook settings only hold an environment variable name.
- Consent stays local.
security.vulnerability.reportingcan be viewed remotely but only changed by editing the file locally. - Saving does not deploy. A save changes the file. Builds read it later using their normal resolution rules.
One nuance from the docs: strict key checking starts in lint. Execution commands such as build and rebuild still load files with unknown keys during a documented transition, and log a warning with the same key path and line. A future breaking release will make them strict as well.
Lifecycle hooks
The problem
Real deployments need project-specific steps: a database migration before the new code starts, a smoke test after it does, a cache warmup before traffic arrives, a notification when it is done. Teams usually bolt these on with a wrapper script around the deploy command, and then the wrapper has no idea whether the deploy rolled back.
The hook points
Hooks (#70) run at eight precise points, each with a defined failure policy:
| Hook | Runs | If it fails |
|---|---|---|
pre_build | before the artifact is built | blocks the deploy |
post_build | after the build, before deploy starts | blocks the deploy |
pre_deploy | before any instance or traffic change | blocks the deploy |
post_start | after the new version is healthy | blocks and triggers the normal rollback path |
pre_traffic | after healthy, before traffic moves | blocks and triggers the normal rollback path |
post_deploy | after the deploy is committed | reported, never undoes the deploy |
pre_stop | before existing instances stop | blocks during a deploy |
post_rollback | after a successful rollback | reported, never fails the rollback |
hooks:
  pre_deploy:
    command: ["./bin/migrate", "up"]
    timeout: 5m
    retries: 2
    retry_interval: 5s
  pre_traffic:
    command: ["./scripts/warm-cache"]
  post_deploy:
    command: ["./scripts/notify", "success"]
    continue_on_error: true
Because pre_traffic runs between "healthy" and "receives traffic", it fits naturally into the blue-green flow described in the blue-green deployment guide: the new version is warmed up while the old one keeps serving.
Safety properties
- No shell.
commandis an argument array, so no metacharacter is interpreted. - Bounded. Timeouts default to 60 seconds with a 30 minute maximum, and retries are capped at 10 with exponential retry intervals.
- Context. Every hook receives variables such as
PHELIX_APP,PHELIX_STRATEGY,PHELIX_VERSIONandPHELIX_PREVIOUS_VERSION. - Idempotent by record. A hook that already succeeded for a deployment is never executed twice, so a retried deploy cannot repeat a migration that already ran.
- Honest about uncertainty. If Phelix dies while a hook is running, the attempt is marked
uncertainand never retried automatically, because Phelix cannot prove what happened. You inspect it and decide. - Auditable. Each attempt is an immutable JSON record with exit code and captured output (capped at 64 KiB per stream), and hook env values and resolved secrets are redacted from it.
phelix hooks status my-app
phelix hooks history my-app --hook pre_deploy --status failed --limit 10
phelix hooks inspect --last my-app
The guide also documents the expand and contract pattern for migrations, which matters in any zero-downtime release. Add nullable columns in pre_deploy, ship code that handles both shapes, and remove the old columns in a later release. A rollback restores the previous binary, not the previous database schema, so never drop or rename a column in the same deploy that stops using it. See the Lifecycle hooks guide.
Deployment rollout analysis
The problem
A health check tells you the new version started. It does not tell you that error rate doubled, P95 latency rose by a third, or memory crept up. Teams usually find that out from users.
What it does
After a successful deploy, Phelix compares a baseline (the period before the deploy, from metrics the local monitor already recorded) with an observed window after it, and stores a report you can read offline (#69).
| Metric | Default regression threshold |
|---|---|
| Error rate | +1.0 percentage point |
| P95 latency | +20% |
| Health check failures | +0 additional |
| Restarts | +0 additional |
| Throughput | -20% |
| CPU average | +25% |
| Memory average | +15% |
Each report gets a status (NORMAL, REGRESSION, IMPROVEMENT, INSUFFICIENT_DATA or NOT_AVAILABLE) and a 0 to 100 Deployment Impact Score with a grade from A to F. Error rate, P95 latency and health failures weigh 3, restarts and throughput weigh 2, and CPU and memory weigh 1. Improvements can add back at most 10 points.
Two design choices stand out. First, missing data is never treated as zero: a metric without enough samples is reported as insufficient data and contributes nothing, so it can neither inflate nor deflate the score. Second, analysis is observability only. It never blocks a deployment, never changes a rollback decision and never fails a deploy when monitoring data is missing.
phelix deployment-report api --latest
phelix deployment-report api --detailed
phelix deployment-report api --version v12 --json
You can tune windows and thresholds under deploy.analysis in phelix.yaml. For canary and progressive rollouts the report also records the step count, the failed step and the abort reason. See the Deployment analysis guide.
Security scanning
Version 1.2.0 covers two separate things, and it helps to keep them apart: your application's dependencies, and the packages on the server that runs them.
Application dependencies
phelix security scan inventories Go and Rust dependencies and evaluates them against OSV.dev advisories, locally. Dependency files are parsed in place, and nothing is built. Findings carry an evidence class, which is the honest part:
affected: the resolved version is established (fromCargo.lock, a pinned replace directive or the resolved Go module graph) and falls inside the affected range.potentially_affected: only a manifest minimum is known, and the reasoning is attached.unknown: it cannot be decided, and it is reported rather than silently cleared.
A scan exits with code 25 when findings reach your configured threshold, so it works as a CI gate. An offline scan that could not check every package reports advisory_coverage: partial and never presents itself as clean. #59 stabilizes this and adds remote gRPC access.
Remote reporting is consent-safe by design (#63). Dependency names and versions are private, so each app opts in with security.vulnerability.reporting: true, and only a local edit to phelix.yaml can grant that consent. Remote mutations use durable request IDs and a persisted outcome, so a dropped connection replays the result instead of running a scan twice. A restarted unfinished operation returns SECURITY_OUTCOME_UNKNOWN rather than executing again.
Server packages and verified remediation
#71 adds phelix security server, which inspects the operating system packages on the host, matches them against distribution advisories and produces a risk score.
phelix security server scan
phelix security server report --severity high
phelix security server preview --package openssl
phelix security server apply --preview-token <token>
phelix security server verify --operation-id <id>
phelix security server reboot-status
Debian, Ubuntu, Alpine and Arch get complete advisory coverage. Fedora, RHEL-family and openSUSE hosts get partial coverage from cached repository metadata, and Phelix says so instead of pretending otherwise. Coverage is reported per scan and never inferred. The risk score ("risk-v1") starts from severity weights, adjusts for CVSS, EPSS and known exploitation, and applies penalties for stale intelligence and old scans. If coverage is incomplete, the status is unknown with no value, so the score is never invented from packages that were not checked.
The remediation workflow is deliberately explicit: preview, apply, verify.
previewruns the package manager's native dry run and stores a plan under a token valid for 30 minutes.applyrequires root, never escalates privileges itself, and refuses to run if the package database is locked or if package versions drifted since the preview. It installs only the previewed packages, never a broad upgrade.verifyruns a fresh scan and marks each packageresolvedonly if the scan shows no remaining findings. The package manager's exit code is never treated as proof of success.
Nothing reboots the host automatically. reboot-status reports whether a restart is needed, always with reasons. See the Security guide and the server package security guide.
Monitoring, logging and remote control
Several smaller changes make the whole system easier to observe.
Proxy traffic in status and the dashboard (#48). phelix status now shows live request traffic: request and error counts, P95 latency and per-backend share. During a rolling or canary deploy this is the quickest way to see whether the new backend is taking traffic and behaving.
One logging pipeline (#49). Phelix produces three kinds of records: its own daemon logs, managed application output and proxy access logs. All of them are written as one JSON object per line and shipped over the same monitor stream, in batches of up to 200 entries, with credential-like field names dropped and values redacted before they reach disk or the wire. The dashboard can now show them.
Monitor lifecycle (#64). Shutdown state handling is more accurate, and the monitor can be restarted remotely.
Monitoring remains opt-in per app. An app with watching disabled sends nothing, and a server whose apps are all unwatched does not even open the stream.
Rust builds and CLI size
Deploying the exact Cargo artifact (#54). The old risk with a Rust deploy is guessing which file Cargo produced, especially in a workspace with several binaries. Phelix now asks Cargo directly. It runs cargo metadata to learn the package and binary targets, then reads the compiler artifact messages from the build to find the executable Cargo actually produced.
Selection is strict: ambiguity is rejected instead of guessed. If a package builds several binaries you get a clear error telling you to pass --bin or set default-run, and a workspace that would build several packages asks for --package. Cargo output is also streamed live during native builds, so a long compile is no longer a silent wait.
Smaller CLI binary (#58). The binary is smaller, and table output is preserved. That matters because Phelix is the one thing you install on every server you manage.
Upgrading to v1.2.0
- Review the release notes and pull requests for the features you use.
- Update the CLI on every host, then restart the monitor so the supervisor, job scheduler and autoscaler start.
- Run
phelix config lintin each project. Unknown keys fail inlint, whilebuildandrebuildcurrently only warn, so you have time to fix them. Addlintto CI now and the future strict release will not surprise you. - Try workers and jobs on a non-critical service first. Remember that only
phelix monitorruns job schedules and the worker supervisor. - Move credentials into the secret store with
phelix secrets set, addsecrets.importsto your config, and remove the same names from plain environment variables. An import whose name is still set as a plain variable stops the deploy with a clear error. - Turn autoscaling on only after you have watched per-replica metrics for a while. Start with a tight
max_replicas.
Documentation lives on the Phelix website, and the full guides are in the repository docs folder.
FAQ
Does Phelix v1.2.0 still work without an account or internet?
Yes. Build, run, deploy and rollback work offline. Dashboard sync, remote commands and remote reporting are opt-in per app.
Can workers and jobs run in Docker?
Not in this release. Workers and jobs are native-runtime only, and a deploy.runtime: docker worker or job is rejected at validation.
Will a rollback bring back an old password?
No. Secrets are resolved from the store at every start, restart and rollback and are never part of a version snapshot, so rollback restores the binary and plain variables while credentials stay current.
Does rollout analysis block a bad deployment?
No. It is observability only. It reports regressions and a recommendation, but it never blocks a deploy or changes a rollback decision. Automatic rollback is handled by the deploy and canary verification paths.
Does autoscaling work for every app type?
It works for rolling services and workers. Classic services, jobs, and canary or progressive rollouts do not use it.